|
 |
| Home | Research | About me | CV | Publications | Contact Me | Links |
|
|||||||||||||||
|
| |||
|
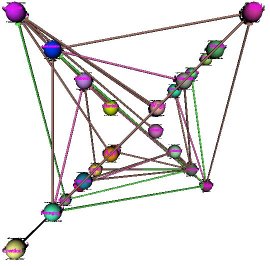
Visualisation using spatial clustering Developing a useful visual display carries a significant cost in time and effort that distracts the researcher from their original interest. As adaptive systems become more complex this will become more of an issue as there will be a greater need for appropriate information visualisation. Yet developing them will carry a greater cost as they need to present ever more complex systems in a simple way that is intuitive for a human to understand. This suggests that as research into computational intelligence develops, there will be a growing need for generic and re-usable tools for information visualisation. Many adaptive systems, such as neural networks and semantic webs, can be seen as graphs built up of nodes and edges. The technique described here uses self-organisation to allow a human to easily see the connections between the clusters inherent in the structure. The algorithm was first developed in Java to output VRML models to allow a human to see the relationships between marked-up knowledge. This produced graphs whereby the nodes are initially unsorted:
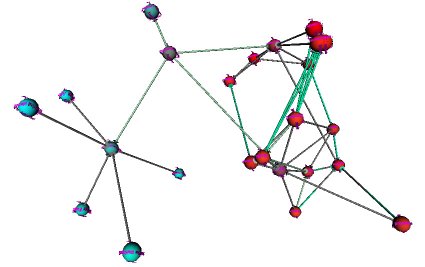
The spatial layout was computed using a variant of the Spring-Embedder model. The model view can be seen as a graph whereby the edges are of a variable length. All nodes are repelled away from each other, but an attractive force exists between nodes that are connected by an edge. These forces are applied until the entire structure reaches an equilibrium.
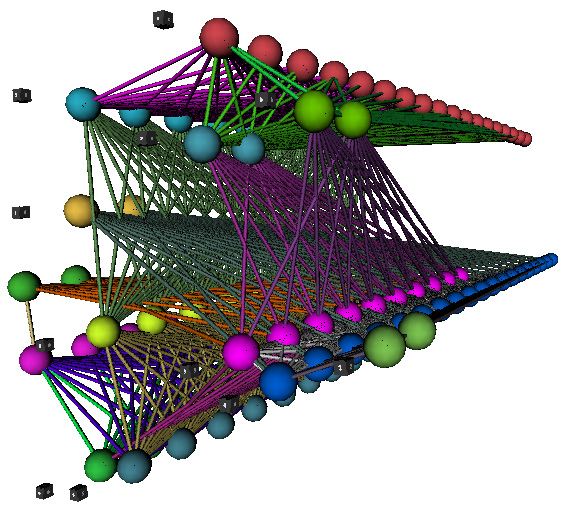
Colour encoding is one way in which information can be easily represented without increasing the complexity of a visual display. Or it can be used to make some information that is already represented more obvious. In the model view, drawing connected nodes closer together shows the clusters that they form. Having all nodes within a cluster coloured the same makes the clusters more obvious to the human eye. It can also show how related partial clusters are if there are many links between them as the colouring can change subtly. There were two requirements for colouring when visualising neural networks. These were that layers that were connected, and also different connections to the same layer, should be coloured as differently as possible. If not, then if a layer of neurons is connected to multiple layers elsewhere in the network then it becomes difficult to discern which connection is output from which layer. Colouring connected layers as differently as possible also helps discern which neuron belongs to which layer for small networks as the layers are drawn closer together. This was achieved by diverging the red, green and blue values (dyes) of the colours of two layers connected by weights, or weights that were connected to the same layer. A percentage of the difference between the same dyes of two RGB values is added or subtracted from each in order to drive them further apart.
|
|||
|